Short-Term Noise Can Lead to Long-Term Opportunity

Key Summary:

  • Markets have more noise and volatility than ever before.
  • The best forward returns happen when we build bigger positions in noisy periods.
  • Being a contrarian when fear, uncertainty, and panic has historically paid handsomely.

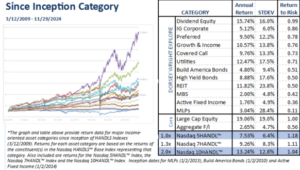
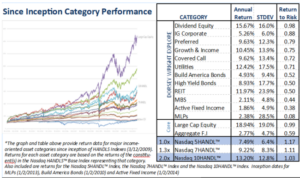
Very Important thesis: If equities generate roughly ~10-11% a year over time, the best companies with leading brands and dominant global franchises, in theory, should compound at 13-15%+ over time. Looking backward, that is exactly what’s happened. Our best opportunity as an investor: buy more great brands when the market acts irrationally short-term. Your long-term returns will thank you.

Today’s Short-term Noise Won’t Last Forever.

With so much fear, uncertainty, and doubt (FUD) in markets and the economy today, I thought I would try and turn this frown upside down using some contrarian thinking. I’ve been an investor for 30 years now, so I’ve seen a lot of different kinds of markets. Between the Internet boom and bust, to the raging housing boom and crash during the GFC to the Covid crash and money printing experiment that created the interest rate and inflationary “normalization” process, the ride has been a wild one. During times like today, it’s important to remember that the short periods of FUD, like hurricanes, don’t generally last very long and when the uncertainty starts to wane, stocks and animal spirits wake up in a big way. It’s only a matter of time.

If you only take one thing from today’s musing, take this: storms are a sideshow to sunnier days. Markets go up 80-85% of the time so it’s in the down periods that we get an opportunity to buy great merchandise on sale so when the sun comes out again, you’ll own more quality and your speed to recovery gets accelerated.

Pessimism is Everywhere. Contrarian Signal?

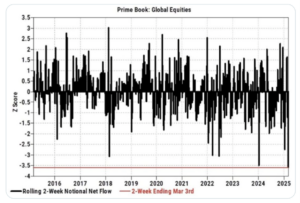
We live in very interesting times. Tariff announcements are happening daily. Self-induced cracks in the economy are developing. Friction is developing between U.S. politicians and our allies. This is a moment in time and cooler heads will prevail in time. Clearly, the market is sniffing out a slowing of economic growth coming from policy uncertainty. While deep selloffs never feel good, this one in particular feels quite extreme because investors of all kinds have simply decided to “step-away” from markets until some certainty re-appears. The selling has been persistent because it’s a 1-sided market for now. Buyers are on strike, sellers and shorts are bold. Need proof? The below chart from Goldman Sachs shows how severe the de-risking has been in a short period of time. Hedge Funds, CTA’s, systematic investors and even regular retail investors, have all been selling due to high bouts of uncertainty.

With few buyers on the other side, the market just drifts lower, and rallies get sold quickly. Imagine what markets will do if/when there is some better policy certainty, consumers and businesses have a better understanding of the rules of the road and earnings variability stabilizes. Sellers will dry up. Shorts will cover. Animal spirits will return with a vengeance. There will be a lot of buyers all rushing back at once. I suggest we all start building bigger positions so when the party heats up, we have a great seat.

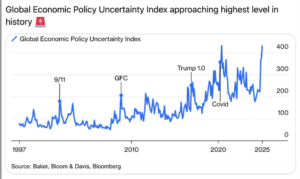
To give you a sense how severe the policy uncertainty is today, the chart below shows an index that measures it. We are higher than any other period over the last 25 years. Kind of incredible really, there were some scary moments in these former spikes. There were some great buying opportunities then too, and they all felt terrible at the time.

To Reiterate:

“De-risked” is not a permanent state. At some point, when either A) markets sell-off to a level where sellers feel like the doom is fully reflected in prices, or B) situations are getting better on a rate of change basis, or C) the major drivers of vol and downside begin to vanish, there’s going to be a complete reversal of the de-risking as re-risking happens all at once. We never know the WHEN, but we do know investors will not stay de-risked forever.

This is not a complex concept but emotionally, it’s often difficult to execute. Trying to pick bottoms is a tricky business, particularly given every day we see a rash of new headlines that algorithms love to trade against. Be systematic about adding exposures to your favorite strategies on deep red days. Do not buy all at once, split your buy orders up and build these positions while the pessimism is incredibly high, and prices are attractive. Remember, volatility and opportunity are neighbors!

Pessimism is Everywhere & It’s at an Extreme.

I cannot tell you when cooler heads will prevail, just that they will one day. I’m sure you have seen all the charts and data showing how cautious and outright pessimistic investors, small businesses and even corporations are becoming. It’s a dangerous game our leaders are playing but the stakes are quite high if they push this too far. Therefore, we should expect they understand the risks too and will manage them accordingly. Here’s a few examples showing the FUD today.

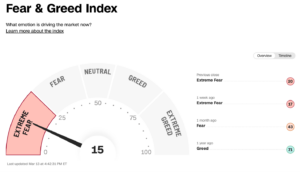
The CNN Fear & Greed Index: Current Reading, Extreme Fear.

This indicator measures 7 important indicators and rolls them into a score. It’s a very low number today, historically a decent spot to start adding to stocks if you have some time. Like most sentiment indicators, only at extremes are they useful as a timing tool.

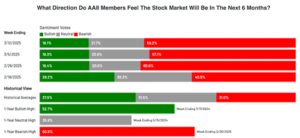
AAII Sentiment Survey: Current Reading, Extreme Bearishness.

This survey has been around for many decades. It helps to measure how positive or negative investors are, likely biased by current market activity. At the extremes, this bearish view has tended to be a wonderful contrarian buy signal.  It’s very rare to see 60% bearishness and <20% bullishness. Historically, these periods offered solid forward returns. Again, having time is important, things can always get more extreme before they get a lot better.

Stock Breadth Washout Signals

One of the ways we measure washouts is knowing what % of the stocks in the S&P 500 and Nasdaq are currently trading above the 20-day moving average. Generally, if under 20% of stocks are trading over the 20day, there’s a decent buying opportunity. Sometimes, volatility and uncertainty are so high, breadth can get fully washed out. I expect that to happen in today’s climate as no end in sight seems visible for these tariff and economic slowdown possibilities The current situation feels a lot like Q4 2018 to me and breadth got to <5% on the Christmas eve low. If we see this kind of extreme reading again in the next month or two, close your eyes and buy some quality stocks, we certainly will with eyes wide open.

Today, March 14, 17% of stocks are trading above this short-term moving average. AKA, we could have more selling until we get fully washed out if politicians keep pushing this odd approach.

Bottom line.

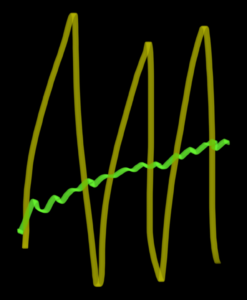
On a day-to-day basis, markets can be volatile. News headlines, earnings, political actions, and plenty of other items can whip-saw our portfolios. The more short-term term we focus, the more angst we can generate. Angst puts pressure on our emotions and emotions make us make irrational decisions. The best advice I can give anyone who invests is this: If you try to wire your brain to be opportunistic when the masses are filled with fear and be cautious when others have euphoria, you will become a very good investor.  Over the long-term, your portfolio will look like the green line, in short periods of time, it can look like the yellow line. Today we focus on yellow, but do not lose sight of the green!

Important Disclosure: The above data is for illustrative purposes only.  This information was produced by Accuvest and the opinions expressed are those of the author as of the date of writing and are subject to change. Any research is based on the author’s proprietary research and analysis of global markets and investing. The information and/or analysis presented have been compiled or arrived at from sources believed to be reliable, however the author does not make any representation as their accuracy or completeness and does not accept liability for any loss arising from the use hereof. Some internally generated information may be considered theoretical in nature and is subject to inherent limitations associated therein. There are no material changes to the conditions, objectives or investment strategies of the model portfolios for the period portrayed. Any sectors or allocations referenced may or may not be represented in portfolios managed by the author, and do not represent all of the securities purchased, sold or recommended for client accounts.  The reader should not assume that any investments in sectors and markets identified or described were or will be profitable. Investing entails risks, including possible loss of principal. The use of tools cannot guarantee performance. The charts depicted within this presentation are for illustrative purposes only and are not indicative of future performance. Past performance is no guarantee of future results.

Private Markets: The Largest Mega Trend in Financial Services

Key Summary:

  • Most of our investment dollars are invested in the casino called public markets.
  • Roughly 90% of companies are private; investors are missing a large market opportunity.
  • The average investor has very little or no private market exposure. This is changing.

Investors Have Virtually No Exposure to the Largest Market in the World: Privates.

As a consumption-based investor, there are several powerful mega-trends happening around the world. One of these trends is happening in the financial services industry and is still a game in the early innings.

Assets are migrating on the margin away from public equities and fixed income and into private market strategies. Institutions have been heavily invested in privates for decades. Its individual investors turn to benefit.

The investment opportunity: Invest in private market funds or invest in the brands gathering the lion’s share of the assets in the wealth management channels: Blackstone, KKR, and Apollo Global. The brands portfolio has chunky allocations to these wonderful brands and the opportunities for growth in assets and fee revenue remains robust.

Why Consider Private Market Exposure?

The stock market has roughly 4600 listed companies with trailing twelve-month total revenues of roughly $23 trillion. That’s a pretty big market.  Blackstone recently stated that about 90% of companies with >$250 million in annual revenue are PRIVATE, not public. There’s an estimated 22 million private companies across small, medium, and large sized companies just in the U.S. The estimated annual revenue is roughly the same as public markets, so most investors are missing half the total opportunity-set by staying “public-only.”  (Advisorpedia). For many years, investing in private companies was quite difficult, but that’s changed dramatically over the last 10 years. Private market access has become easier and often doesn’t require locking up our capital like it used to. New innovations in semi-liquid strategies seem to be introduced every day and are being consumed at a rapid rate but it’s still inning 1-2 given the estimated $80 trillion size of the wealth management channel. There’s a significant amount of fee-revenue and asset growth to come.

Blackrock, an asset manager with >$11 trillion in assets has recently made several large acquisitions of private market asset managers clearly see’s what we see. Goldman Sachs, in this week’s earnings call also stated a major initiative to grow their alternative asset management capabilities. Everyone sees the flows and they have done the same math.

Why Are HNW Investors Allocating to Privates?

In one word: diversification. But there’s more to the story. The bulk of the wealth in the U.S. and around the globe is with older consumers. They have been working, saving, and collecting assets for many decades. As we get older, our appetite for risk and volatility tends to fall. Because of algorithms, a wild index options market, and the voracious appetite for short-term trading, the public markets have become much more casino-oriented and volatile than at any time in my 30-year career. Wild volatility wears most investors out. People get emotional and emotions often drive poor decision making which ultimately hurts their ability to generate attractive returns. For a variety of reasons, even the public bond market feels more and more like a casino. And returns have been sub-par across most of the bond complex.

So, all or most of the largest pool of assets ever collected is invested in assets that are more volatile than ever and at a time when the owner of these assets wants a less volatile experience with lower risk of losses. That profile does not seem to jive with today’s public markets. Enter private markets. Here’s a few key reasons Advisors are allocating more and more to private markets. And I do not see this stopping, the problem is acute and the desire for other options is extreme:

  • Lower daily volatility – because these do not have to mark to market daily, the volatility is significantly muted. That helps reduce total portfolio volatility meaningfully which keeps investors engaged and sleeping well even during volatile periods. This keeps them on-track for goal achievement. In my opinion, this is the most important reason major asset flows are moving to private assets. Advisors & investors really like this feature.
  • Potentially better returns – if investors are going to give up some daily liquidity, they should demand better returns. That’s exactly what has been delivered by the best private market asset managers over many decades. Which firm and funds one chooses, is important. The best of the best has generally delivered solid returns per unit of risk.
  • Diversification across thematics – Public market portfolios are very similar and crowded in a handful of companies. We think we have a diversified portfolio, but we just have “beta & size exposure.” Generally, people do not have much exposure to things like inflation-oriented assets, differentiated real estate, private credit, infrastructure, private equity, next-gen energy innovation, etc. Adding exposure to many of these assets offers solid diversification from the crowded public markets.

Bottom Line:

Most individual investors are missing a major opportunity for attractive total returns that are delivered via a much smoother journey. With new and ongoing innovation, more migration of assets away from the public market casino and into private market strategies is sure to happen. This is a mega trend early in its lifespan. Investing in the leading brands gathering the most amount of assets while delivering for clients seems to be a logical decision.

What’s most unbelievable: the stocks of the most relevant alternative asset managers are still incredibly under-owned at the index-level and generally in portfolios. Investing in the leading private managers is not a crowded trade. We expect many more to invest in these stocks as the benefits become more obvious. Today’s “private equity” asset managers are not the same businesses they were in the wild 1980’s.

Disclosure: The above data is for illustrative purposes only.  This information was produced by Accuvest and the opinions expressed are those of the author as of the date of writing and are subject to change. Any research is based on the author’s proprietary research and analysis of global markets and investing. The information and/or analysis presented have been compiled or arrived at from sources believed to be reliable, however the author does not make any representation as their accuracy or completeness and does not accept liability for any loss arising from the use hereof. Some internally generated information may be considered theoretical in nature and is subject to inherent limitations associated therein. There are no material changes to the conditions, objectives or investment strategies of the model portfolios for the period portrayed. Any sectors or allocations referenced may or may not be represented in portfolios managed by the author, and do not represent all of the securities purchased, sold or recommended for client accounts.  The reader should not assume that any investments in sectors and markets identified or described were or will be profitable. Investing entails risks, including possible loss of principal. The use of tools cannot guarantee performance. The charts depicted within this presentation are for illustrative purposes only and are not indicative of future performance. Past performance is no guarantee of future results.

Income Shines: November 2024 HANDLS Monthly Report

Income Sectors Shine

November proved to be a strong month for income-focused investments, with all sectors delivering positive returns despite market volatility. Leading the charge were MLPs, which surged 12.60%, benefiting from a favorable energy environment and rising commodity prices. This sector’s robust income generation continues to attract investors seeking yield in a stable energy backdrop. REITs followed far behind with a 3.54% return. While interest rates remain a challenge, strong demand for both commercial and residential properties kept the sector resilient. Similarly, Dividend Equities posted a strong 5.40%, benefiting from the broader market’s continued strength and providing investors with a balance of income and growth. Utilities delivered 3.78%, as their defensive nature remained appealing to investors seeking stability. With ongoing market uncertainty, the reliable income stream from utilities remains attractive. Growth & Income strategies also performed well, returning 5.84%, reflecting a mix of steady income and equity exposure. High Yield Bonds generated a modest 1.67%, as investor appetite for riskier assets remained cautious in the face of tighter credit spreads. Covered Calls posted 4.31%, as the strategy took advantage of solid equity performance while generating additional income through options.

In fixed income, Preferreds saw a modest 0.80% return, weighed down by ongoing interest rate pressures. However, Build America Bonds and MBS performed decently with returns of 1.66% and 1.51%, respectively, supported by favorable market conditions in infrastructure and mortgages. Investment Grade Corporate Bonds saw a moderate 1.26%, while Active Fixed Income strategies posted 1.34%, as managers adjusted exposures to navigate rate changes. On the equity front, Large Cap Equity returned 5.57%, reflecting strong corporate earnings.

For the Nasdaq HANDL™ Indexes, November was a very solid month highlighting the strength of a diversified basket. For the month of November:

  • Nasdaq 5HANDL™ Index: 3.78%
  • Nasdaq 7HANDL™ Index: 4.81% (1.3x leveraged)
  • Nasdaq 10HANDL™ Index: 7.24% (2.0x leveraged)

Overall, November demonstrated the resilience of income-focused investments across various sectors, offering solid returns in a dynamic market environment. As interest rates continue to adjust, investors are finding attractive opportunities in sectors that blend stability and income, reinforcing the value of diversification within portfolios.

Disclosure: Nasdaq® is a registered trademark of Nasdaq, Inc. The information contained above is provided for informational and educational purposes only, and nothing contained herein should be construed as investment advice, either on behalf of a particular security or an overall investment strategy. Neither Nasdaq, Inc. nor any of its affiliates makes any recommendation to buy or sell any security or any representation about the financial condition of any company. Statements regarding Nasdaq-listed companies or Nasdaq proprietary indexes are not guarantees of future performance. Actual results may differ materially from those expressed or implied. Past performance is not indicative of future results. Investors should undertake their own due diligence and carefully evaluate companies before investing. ADVICE FROM A SECURITIES PROFESSIONAL IS STRONGLY ADVISED. © 2024. Nasdaq, Inc. All Rights Reserved

Important Disclosure. HANDLS Indexes receives compensation in connection with licensing its indices to third parties. Any returns or performance provided within are for illustrative purposes only and do not demonstrate actual performance. Past performance is not a guarantee of future investment results. It is not possible to invest directly in an index. Exposure to an asset class is available through investable instruments based on an index. HANDLS Indexes does not sponsor, endorse, sell, promote or manage any investment fund or other vehicle that is offered by third parties and that seeks to provide an investment return based on the returns of any index.  There is no assurance that investment products based on an index will accurately track index performance or provide positive investment returns. HANDLS Indexes is not an investment advisor, and HANDLS Indexes makes no representation regarding the advisability of investing in any such investment fund or other vehicle. A decision to invest in any such investment fund or other vehicle should not be made in reliance on any of the statements set forth in this document. Prospective investors are advised to make an investment in any such fund or other vehicle only after carefully considering the risks associated with investing in such funds, as detailed in an offering memorandum or similar document that is prepared by or on behalf of the issuer of the investment fund or other vehicle. Inclusion of a security within an index is not a recommendation by Indexes to buy, sell, or hold such security, nor is it considered to be investment advice. The information contained herein is intended for personal use only and should not be relied upon as the basis for the execution of a security trade. Investors are advised to consult with their broker or other financial representative to verify pricing information for any securities referenced herein. Neither Indexes nor any of its direct or indirect third-party data suppliers or their affiliates shall have any liability for the accuracy or completeness of the information contained herein, nor for any lost profits, indirect, special or consequential damages. Either Indexes or its direct or indirect third-party data suppliers or their affiliates have exclusive proprietary rights in any information contained herein. The information contained herein may not be used for any unauthorized purpose or redistributed without prior written approval from HANDLS Indexes. Copyright © 2024 by HANDLS Indexes. All rights reserved.


Building a Winning Portfolio for Trump’s Second Term

As speculation grows about a potential second Trump presidency, investors brace for a major shift in the markets. Energy stocks lead the charge, while cryptocurrencies remain a hot topic despite regulatory uncertainty. But is following the crowd the right move? Opportunities are emerging in unexpected places, and pitfalls abound for the unwary. Now is the time to craft a portfolio that not only survives but thrives in a Trump 2.0 economy.

Building a portfolio for a second Trump term means focusing on companies positioned to benefit from shifting regulatory priorities and trade dynamics. Tesla, Palantir, and Amazon stand out as key players likely to excel amid these changes. They are well-prepared to thrive in a trade war and capitalize on regulatory shifts. Blockchain technology is set to grow, but the regulatory uncertainty around Bitcoin makes direct investment risky. Nvidia and PayPal offer a safer way to tap into the blockchain boom, with potential gains whether Bitcoin thrives or a new digital currency takes the lead. This strategy creates a balanced approach, navigating both opportunities and risks in a Trump 2.0 economy.

Challenges for Energy Stocks Under a Trump Presidency

While the prospect of increased oil drilling on federal land and the opening of pipelines is widely seen as a boost to domestic energy production, the implications for energy stocks are more complex.

Recent Gains Already Priced In

Energy stocks have seen significant appreciation in recent months, largely driven by strong oil and natural gas prices. However, if a Trump administration leads to reduced geopolitical tensions or increased domestic production, commodity prices could decline. This could erode some of the recent gains, making further upside for energy stocks less certain.

Oversupply Risks

A more permissive regulatory environment could spur higher production levels of oil and natural gas. While this might benefit consumers through lower prices, it could also lead to supply gluts. Lower commodity prices would compress profit margins for energy companies, even as operational costs decrease.

Demand Uncertainty

Policies favoring domestic energy independence could inadvertently limit exports, reducing revenue opportunities for major energy players. At the same time, global initiatives to expand renewable energy adoption could create long-term demand challenges for traditional energy sources.

Tesla (TSLA): Leading the Charge in a Looser Regulatory Environment

Tesla stands out as a clear winner in a world of relaxed regulations and shifting trade policies.

  1. Minimal Impact from EV Tax Credit Removal
    While the removal of EV tax credits could hurt competitors like the Big Three automakers, Tesla is well-positioned to weather the change. Its strong brand and market dominance, coupled with a loyal customer base, make it less reliant on subsidies to drive sales.
  2. Domestic Manufacturing Advantage
    Tesla’s manufacturing approach gives it a unique edge. Unlike the Big Three, which depend heavily on components sourced from Mexico, Tesla produces many of its parts domestically at its Gigafactory in Texas. This reduces exposure to potential tariff hikes on imports and aligns well with policies prioritizing U.S.-based manufacturing.
  3. Potential Boost from Infrastructure Spending
    Investments in infrastructure under a second Trump term could include provisions for expanding EV charging networks, further supporting Tesla’s ecosystem. As the leader in electric vehicle adoption, Tesla would be a prime beneficiary of such initiatives.

Under these conditions, Tesla not only maintains its dominance but strengthens its position in the rapidly growing EV market.

Amazon (AMZN): A Strategic Shift for Political Neutrality

Amazon’s approach heading into a second Trump presidency suggests a calculated strategy to navigate the political landscape more effectively.

  1. A More Neutral Bezos
    Unlike during Trump’s first term, when tensions between the administration and Jeff Bezos over The Washington Post culminated in Amazon losing a major government contract to Microsoft, this time Bezos appears to be charting a more neutral course. The Washington Post notably refrained from endorsing any candidate in the recent election, potentially easing political friction that previously affected Amazon’s federal prospects.
  2. Regulatory Tailwinds for Distribution
    Amazon’s extensive network of distribution centers stands to benefit significantly from loosened regulations. Policies reducing red tape around zoning, labor laws, and environmental restrictions could lower operational costs and accelerate expansion. This positions Amazon to enhance its dominance as one of America’s largest employers and an indispensable player in e-commerce logistics.
  3. A Potential Ally in Job Creation
    As one of the country’s largest employers, Amazon’s contributions to local economies may resonate with Trump’s focus on domestic job creation. This dynamic could foster a more favorable relationship between the administration and the company, paving the way for new government contracts or policy advantages.

By taking a more politically neutral stance and leveraging reduced regulations, Amazon could position itself to thrive in a Trump 2.0 economy while avoiding the pitfalls of previous conflicts.

Palantir (PLTR): Driving Efficiency in Government and National Security

Palantir stands out as a company uniquely aligned with the priorities of a potential second Trump administration, particularly in its focus on cost reduction and AI-driven solutions.

  1. Support for Government Efficiency
    With a renewed emphasis on cutting government spending and increasing efficiency, Palantir’s technology is well-positioned to shine. Its suite of data analytics tools has already proven effective in streamlining processes and reducing costs for federal agencies, making it an attractive partner in an era of fiscal restraint.
  2. Alignment with the AI Revolution
    As artificial intelligence reshapes industries, Palantir’s advanced AI capabilities put it at the forefront of this technological transformation. The company’s ability to harness big data for actionable insights positions it as a key player in enhancing both efficiency and effectiveness for public and private sector clients alike.
  3. Opportunities in Defense and Security
    A second Trump presidency would likely bring continued investment in defense and border security, areas where Palantir has significant expertise. The company’s long-standing government contracts and proven track record in national security applications align perfectly with policies emphasizing border control and domestic safety.

By bridging the gap between cost-cutting measures and technological innovation, Palantir offers a compelling investment case in an administration focused on streamlining government operations.

Cryptocurrency Risks Under a Trump Presidency

While the deregulation mindset could help blockchain technology flourish, cryptocurrencies, especially Bitcoin, could face significant risks in a second Trump administration.

  1. Regulatory Uncertainty:
    Trump has expressed skepticism about cryptocurrencies, including Bitcoin, often viewing them as a threat to the U.S. dollar. While his administration may push for broader deregulation, this uncertainty could lead to selective regulation that benefits certain tokens and harms others. Investors could face sudden shifts in policy, leaving the crypto market vulnerable to unpredictable legal changes.
  2. Geopolitical Risks:
    A nationalist agenda could lead to trade restrictions or limitations on foreign blockchain projects, undermining international collaboration. Such moves might reduce liquidity in the crypto market, as cross-border transactions and investments could be curtailed. If foreign blockchain projects or cryptocurrencies are seen as competitors to U.S. interests, they may face heightened scrutiny or even bans.
  3. Market Volatility:
    Cryptocurrencies are already known for their volatility. If the U.S. government takes an inconsistent or unclear approach to regulating crypto, it could exacerbate this volatility, further deterring institutional investors and retail traders alike. The uncertainty surrounding their future use could result in major price swings, making it a risky asset class for those seeking stability.
  4. Risk of Outright Bans:
    Imagine a scenario where a terrorist attack occurs under a Trump presidency, and it’s discovered that Bitcoin was used to finance the terrorists’ operations. In this situation, Bitcoin could be outlawed with the snap of a finger, as the government could move quickly to curtail its use in illicit activities. The decentralized nature of Bitcoin and other cryptocurrencies might offer some resistance, but governments have the power to impose bans, making such an event a significant risk for investors.

Nvidia (NVDA): Blockchain and AI Synergy

Nvidia (NVDA) stands out as a key player in both the AI and blockchain space, making it a strong candidate to benefit from the emerging blockchain revolution, even though its core business is centered around AI technologies.

  1. Leader in Cryptocurrency Mining Hardware:
    Nvidia’s graphics processing units (GPUs) are a critical component in the mining of many altcoins. While the company’s primary growth engine remains AI and data centers, the demand for its high-performance GPUs from the cryptocurrency mining community has been a significant revenue contributor. In a deregulated environment where blockchain adoption grows, Nvidia stands to benefit from increased demand for mining equipment, especially for altcoins that depend on GPU power for validation.
  2. AI & Blockchain Synergy:
    The AI revolution and blockchain are increasingly intertwined. Nvidia’s expertise in building GPUs for AI processing makes the company well-positioned to benefit from the growth of blockchain technology, which requires heavy computational power. As AI-driven applications become more widespread, Nvidia’s hardware will continue to support both AI-driven financial systems and blockchain technology, positioning the company as a dual beneficiary in this evolving landscape.
  3. Infrastructure Investment:
    As blockchain networks expand and new altcoins emerge, the demand for high-performance computing infrastructure will likely increase. Nvidia’s robust portfolio of GPUs places it in an excellent position to capitalize on this trend. While regulatory uncertainties may impact certain cryptocurrencies, Nvidia’s role in the underlying infrastructure that supports both crypto and AI will help secure its continued success, regardless of market fluctuations in individual tokens like Bitcoin.

PayPal (PYPL): Positioned for Blockchain Integration and E-commerce Growth

PayPal, a trailblazer in online payments, is well-positioned to take advantage of the blockchain revolution, leveraging its vast network, innovative fintech services, and history of disruption in the payments space. Though its leadership has changed over the years, the company’s foundational role in the evolution of digital payments links it directly to the ongoing transformation in both e-commerce and cryptocurrency.

  1. E-commerce and Fintech Growth:
    With deregulation in financial technology, PayPal has a unique opportunity to expand and innovate in the online payment ecosystem. The loosening of regulatory barriers could allow PayPal to offer even more diverse payment solutions, potentially incorporating blockchain technology to facilitate faster, more secure transactions. Whether it’s Bitcoin or a new cryptocurrency, PayPal’s infrastructure is primed to serve as a major player in the future of digital payments, continuing its legacy of simplifying online transactions.
  2. Blockchain Integration:
    Though PayPal has integrated cryptocurrency into its platform, its true potential lies in its ability to take advantage of blockchain technology more broadly. Having been at the forefront of digital payments, PayPal is positioned to expand into new forms of payment, such as cryptocurrency transactions, by leveraging its global user base. Whether it’s Bitcoin or another token that emerges as dominant, PayPal is ready to act as a major facilitator in online payments, driving adoption of digital currencies while serving as a bridge to the traditional financial system.
  3. Tax Incentives for Digital Transactions:
    A pro-digital tax policy that incentivizes cashless and cryptocurrency transactions could be a significant boon for PayPal, which already benefits from widespread adoption across merchants and consumers. With a focus on reducing transaction costs and enabling faster, more seamless payments, PayPal is poised to benefit from these policy shifts and extend its leadership in the digital payment space.
  4. Expansion of Small Business Support:
    Policies aimed at supporting small businesses could further accelerate PayPal’s growth. By providing small and medium-sized businesses with easy access to payment processing services, PayPal stands to benefit from both its established merchant services and its ability to adapt to new, deregulated payment systems, including those based on blockchain technology.

Conclusion

A potential second Trump presidency could reshape the landscape for innovation and investment, especially in technology, finance, and infrastructure. The former president’s deregulation mindset may create opportunities for companies like Tesla, Amazon, Palantir, and PayPal to thrive. However, it also presents significant risks for cryptocurrencies and blockchain projects.

Companies that adapt to changing regulations could see major growth. Tesla could benefit from policies supporting electric vehicles and domestic manufacturing. Amazon, a logistics giant, may strengthen as regulations ease. Palantir, with its advanced AI and data analytics, is positioned to capitalize on increased government scrutiny and national security priorities. PayPal, deeply rooted in digital payments, stands ready to embrace blockchain technology and the cashless trend.

But the risks are real. Cryptocurrencies could face significant hurdles, from regulatory uncertainty to geopolitical tensions. If the Trump administration cracks down on cryptocurrencies, Bitcoin and others could face existential challenges. However, blockchain technology itself may still thrive as part of a broader trend.

In conclusion, a second Trump term offers both opportunities and risks. Investors must stay vigilant. Success will depend on adapting to new policies, embracing innovation, and navigating government shifts. The most successful companies will be those that can balance growth with careful strategy in uncertain times.

David Miller on CNBC’s Market Navigator: Will Overheating Hurt Nvidia?

Will Mag 7 stock Nvidia beat estimates? David Miller, Co-Founder and Chief Investment Officer of Catalyst Funds, Rational Funds, and Strategy Shares, provided his insights to CNBC on Nov. 19 on why he believes the company will come out ahead this week despite potentially challenging headlines.

Chart of the Week: is the Stock Market Getting Ahead of Itself?

S&P 500 Cyclically Adjusted Price-to-Earnings Ratio (CAPE)

Even before November’s post-election rally, Wall Street was growing increasingly worried that the stock market was starting to get ahead of itself.

  • In October, Goldman Sachs strategists cautioned investors to be prepared for stock market returns during the next decade that are toward the lower end of their typical performance distribution.
  • As of November 11, 2024, the cyclically adjusted price-to-earnings ratio (or CAPE) hit a staggering 38.12x. Looking at these valuation levels going back to 1900, there has only been one instance where the S&P 500 produced a positive return in the following 10 years. In July 1998, the CAPE hit 38.26x and the 10-year return after was 0.84% annualized.
  • S&P 500 10-year returns averaged -2.75% annualized following valuations like in November 2024.

What’s the Real Value of Active Management?

Key Summary:

  • ETF’s have become the preferred investment wrapper of choice for investors.
  • The vast majority of ETF assets are passive, rules-based, & market-cap weighted.
  • Active strategies with high tracking error can add significant value to the portfolio mix.

Very Important thesis: If equities generate roughly ~10-11% a year over time, leading brands, dominant global franchises, particularly those serving the dominant driver of the economy, in theory, should compound at 13-15%+ over time. In a world where rates and inflation will likely trend higher for longer, business models with pricing power, exposure to quality factors, and that generate strong profits and free cash are set up to win versus broad markets. Brands Matter.

ETFs are the Preferred Investment Wrapper.

The data is very clear: actively managed mutual funds continue to lose assets to ETF’s. That’s the headline we all see every day. Remember, headlines are bold because they want your attention, the real story lives in the details. It makes sense that a portion of the active market is losing share to ETFs. Why pay a higher fee for a less tax efficient strategy, particularly if it’s a closet index strategy? In my opinion, true active strategies have a very important role in portfolios as complements to passive, cheap beta. Advisors need to understand what they own. Are the active funds’ benchmark huggers or do they do things very differently than the benchmark? Is there a similar strategy available in an ETF wrapper? Important: to have the chance to beat a benchmark, a strategy needs to look very different than the benchmark. The way to track this is by using Tracking Error. A high tracking error means the fund looks very different and can therefore be very valuable to a portfolio from a diversification and returns perspective. If you can get access to the themes you want and do it in a tax efficient wrapper while gaining high tracking error, congratulations, that’s valuable! Spoiler alert: that’s not easy to do, it requires a lot of research and sadly, the analytics providers do not make the research easy because they rarely look at the sector, sub-industry, and single-stock level.

In this week’s note, I’ll make the case that active deserves a place in portfolio’s along with passive ETF’s. Thank heavens there are more active ETF’s being launched because the market has been dominated by passive, rules-based, market cap weighted ETF’s (90% of ETF assets). What does that mean for a portfolio? It means more and more portfolio’s look the same and they are more tied to MOMENTUM as a style factor than ever before. That works until it doesn’t. This also means, benchmark hugging active managers are also too tethered to the momentum factor making “size and momentum” the biggest part of most portfolios.

Active, Contrarian Opportunities Are Everywhere.

Image: Created for Eric Clark by ChatGPT.

I am not saying run from passive, market-cap weighted ETF’s, I’m simply saying properly active strategies should be blended with passive, so portfolio’s get the benefit from many different style factors and exposures. As more and more “active funds” take on more passive characteristics, the value of true active strategies will grow by leaps and bounds. One area that’s likely the least crowded trade: the Consumer Discretionary, Consumer Staples, and Communication Services sectors. Our team traffics in highly relevant, high quality global brands. Many of which live in these three sectors and as you can see below, at the index level, these sectors are under-represented in a meaningful way, while a heavy tech weighting drives the returns. If the S&P 500 is the proxy investment for an allocation to the U.S. economy, and the economy is 70% household consumption, why on earth would the weighting to Consumer Discretionary & Staples be this low? We think that’s the opportunity today for investors.

I can almost guarantee your portfolio is chronically underweight the primary beneficiaries of a consumption-led economy. As you can see below, Tech holds the highest weighting across blend and growth indexes and Consumer Discretionary, Staples, and Communication Services is low. In the brands portfolio, we have 2-3x the discretionary and staples exposure, 40% more communication services and one-third the tech exposure. Our tracking error is almost 10, and this is not an accident.

What Does High Tracking Error Look Like?

To highlight the high tracking error theme, below I show a chart of the top 10 brands and the weights in the Brands portfolio relative to the S&P 500 and the Russell 1000 Growth Index. Remember, these two broad style boxes are where the bulk of the typical portfolio is allocated. In the brands strategy, we focus on the dominant global theme of household consumption and business innovation spending through the leading brands. According to the economy and business cycle, we allocate to important sub-themes through market share leaders. Here’s why the tracking error is high. We own a lot of brands that are significantly under-represented or fully absent from indexes. That’s valuable!

The Top 10 Brands in the Brands Portfolio (57% of the total):

  1. Amazon: 15% versus 3.8% (S&P 500), 6.6% (R1Growth).
  2. Apollo Global: 6% versus ,0.55% in both indexes.
  3. Netflix: 5% versus <1.2%.
  4. Live Nation: 4.9% versus essentially 0%.
  5. Blackstone: 5% versus <.50%.
  6. Chipotle: 4.9% versus <.30%.
  7. KKR: 4.9% versus <0.20%.
  8. Costco: 4.7% versus <1.5%.
  9. L’Oreal: 4.7% versus 0%.
  10. Meta: 4.6% versus <4%.

Bottom Line:

  1. If you own any active funds or ETF’s, make sure they are truly active and have high tracking error to the benchmark.
  2. Blend active and passive in a portfolio to achieve maximum diversification and return benefits.
  3. Do not ignore the winners in a consumption led global economy, these brands are wonderful businesses, have significant economic moats, generate massive profits, and always have demand for their shares when the stocks go on sale. That makes them terrific adds to a portfolio and right now, buying consumer-focused brands is likely the least crowded trade in markets.

BE A CONTRARIAN

Disclosure: The above data is for illustrative purposes only.  This information was produced by Accuvest and the opinions expressed are those of the author as of the date of writing and are subject to change. Any research is based on the author’s proprietary research and analysis of global markets and investing. The information and/or analysis presented have been compiled or arrived at from sources believed to be reliable, however the author does not make any representation as their accuracy or completeness and does not accept liability for any loss arising from the use hereof. Some internally generated information may be considered theoretical in nature and is subject to inherent limitations associated therein. There are no material changes to the conditions, objectives or investment strategies of the model portfolios for the period portrayed. Any sectors or allocations referenced may or may not be represented in portfolios managed by the author, and do not represent all of the securities purchased, sold or recommended for client accounts.  The reader should not assume that any investments in sectors and markets identified or described were or will be profitable. Investing entails risks, including possible loss of principal. The use of tools cannot guarantee performance. The charts depicted within this presentation are for illustrative purposes only and are not indicative of future performance. Past performance is no guarantee of future results.

Thematic Investing Can Add a Ton of Value to Portfolios

Key Summary:

  • Earnings season has begun, we have some solid reports across the brands universe.
  • Streaming video & entertainment has become a consumer staple. Netflix wins.
  • In the asset management industry, private markets are where the information advantages are real. Blackstone wins.

Very Important thesis: If equities generate roughly ~10-11% a year over time, leading brands, dominant global franchises, particularly those serving the dominant driver of the economy, in theory, should compound at 13-15%+ over time. In a world where rates and inflation will likely trend higher for longer, business models with pricing power, exposure to quality factors, and that generate strong profits and free cash are set up to win versus broad markets. Brands Matter.

Earnings Season Has Begun. Here’s a few portfolio brands executing well.

I love earnings season. Each quarterly report is a new piece of the puzzle, and it lets us know what management teams are thinking about their respective businesses, industries, and the economy in general. Remember, our investment in stocks is a De facto vote of confidence on the economies in which we invest. Earnings, revenue, margins, free cash flow, and the growth of these important metrics is what drives stocks up or down over time. As someone who invests but also likes to actively trade when markets act irrational, earnings season tends to offer some wonderful tactical trading opportunities along with offering great, long-term information for buy-hold investors. The next few notes, I’ll discuss some earnings reports and secular themes we are very excited about for the future.

Image created in 10 seconds using AI via ChatGPT. Very cool!

Netflix: NFLX

Remember when the cable industry was one of the most stable and predictable industries?

Legacy media brands sat by and let a new company, Netflix carve out a new market and take market share slowly, then all at once. Fast forward to today, Netflix is now the new cable and the first place most consumer begin their entertainment and content search. This nuance is a massive behavioral moat for Netflix, and I never hear anyone talking about it. Netflix reported a strong and stable quarter on October 17th and the stock is +10% on the 18th, last I checked. Here’s why we continue to like Netflix and why it’s a core holding as a dominant Mega Brand and a consumer staple.

The Report & Our View of the Stock:

Lots of growth potential around the world. 283 million paid subscribers headed much higher over time. Q3, revenue +15% YOY, operating margins 30% vs 22% last year. For Q4, they forecast 15% revenue growth and expect paid net additions to be higher than this quarters 5.1M sub growth. For 2025, they forecast revenue of $43-44B which is +11-13% growth, slower than 2024 but we expected this to moderate as password sharing opportunities diminish. Margins should continue to rise over time as content spend stays stable and revenue and free cash flow expand. And make no mistake, Netflix has solid pricing power to raise prices and drive more ad-tier subs. This business has become a solid consumer staple that adds significant value to a consumer’s life as a primary entertainment provider. The low cost of the service keeps churn low and engagement solid. Live sports and sports-related content will continue to grow bringing in new entrants. NFLX had the benefit of building a massive library of content fueled by debt when rates were largely at ZERO while peers in the industry sat idle and watched NFLX take their businesses. Now they are scrambling to compete in a world with much higher cost of capital and higher content costs. All in all, Netflix offers one of the best value propositions to consumers, has become THE place consumers start their content and entertainment searches which keeps churn low and pricing power high. This is a very powerful flywheel that grows over time with new and intriguing content added.  Traditional consumer staples grow much less, do not generate this kind of profitability and margins and trade at the same multiple or higher as Netflix. More and more, consumer staple brands do not just live in the staples sector. With technology at the center of our lives, there are plenty of tech staples located in plain sight. Yes, tech and communication services stocks can be volatile, but just because their stock can be volatile, do not assume their business is volatile so when these staples go on sale, they are wonderful buying opportunities.

Blackstone: BX

The democratization of alternatives via private market access continues. Blackstone is the largest alternative asset manager on the planet at $1.1Trillion and growing assets at a rapid clip. The crazy part: there is so much room for growth ahead, particularly in the wealth management industry as most HNW investors have very little exposure overall. Here’s a crazy truth: these stocks are very under-owned and underrepresented in indexes, ETF’s, and active funds. And they have been massive alpha generators over the S&P 500. Apollo still needs to be added to the S&P and it’s a matter of WHEN, not IF.

The Brands portfolio owns a basket of the leaders because the secular growth opportunity remains enormous. Blackstone, KKR, Apollo and these brands are the smartest investors around the globe, have massive access to capital in good times and bad, have a wicked information advantage because they each own hundreds of private companies that give them the ability to look around corners for future trends. And they have hundreds of billions in dry powder to buy assets when they go on sale. No matter what the calamity, these great investors always seem to find a way to capitalize on turmoil. Stable, attractive performance just drives more asset flows which drives higher fee revenue which drives the stocks higher.

Like Netflix, the alts business is a wonderful flywheel and the benefits compound over time at scale. Just remember, these stocks can be volatile at times, so you often get a chance to buy them on dips. We love to hold the core position and trade around the position, using the vol to our advantage.

The Report & Our View of the Stock:

Overall, a solid quarter with solid trends for a good 2025. Massive $40.5B new flows this quarter dominated by private credit & insurance but good overall flows into Infrastructure, core PE, plus good fund raising in other real estate and opportunistic credit funds. Management fees $1.7B. Deployed $34B broadly across credit, PE, RE but credit was the big deployment area. Performance stable and solid across fund verticals, with real estate slowly recovering.  $1.17T in assets with $171B in dry powder, so they have massive opportunities to put a lot of money to work over time and to generate solid fees that grow over time. 2025 is expected to show better realizations, and deployments as M&A heats up and sentiment gets better leading to more deals. Their deployments continue to be focused on data centers globally, AI, software, life sciences, and shelter opportunities along with renewables and energy. All of which tend to be solid inflation beneficiaries as rates are expected to stay elevated with elevated inflation.

Image created in 10 seconds using AI via ChatGPT.

Disclosure: The above data is for illustrative purposes only.  This information was produced by Accuvest and the opinions expressed are those of the author as of the date of writing and are subject to change. Any research is based on the author’s proprietary research and analysis of global markets and investing. The information and/or analysis presented have been compiled or arrived at from sources believed to be reliable, however the author does not make any representation as their accuracy or completeness and does not accept liability for any loss arising from the use hereof. Some internally generated information may be considered theoretical in nature and is subject to inherent limitations associated therein. There are no material changes to the conditions, objectives or investment strategies of the model portfolios for the period portrayed. Any sectors or allocations referenced may or may not be represented in portfolios managed by the author, and do not represent all of the securities purchased, sold or recommended for client accounts.  The reader should not assume that any investments in sectors and markets identified or described were or will be profitable. Investing entails risks, including possible loss of principal. The use of tools cannot guarantee performance. The charts depicted within this presentation are for illustrative purposes only and are not indicative of future performance. Past performance is no guarantee of future results.


Investing in Big Rivers is a No-Brainer, Common Sense Decision.

Key Summary:

  • There is no other broad market theme bigger than global consumer spending.
  • The easiest and most defendable allocation decision is to add consumer exposure.
  • The equal-weight Consumer Discretionary basket continues to outperform Staples.

Very Important thesis: If equities generate roughly ~10% a year over time, leading brands, dominant global franchises, particularly those serving the dominant driver of the economy, in theory, should compound at 13-15%+ over time. In a world where rates and inflation will likely trend higher for longer, business models with pricing power, exposure to quality factors, and that generate strong profits and free cash are set up to win versus broad markets. Brands Matter.

Don’t Ignore a $50+ Trillion Theme in Your Portfolio.

The U.S. is a roughly $28 trillion economy and a leader in innovation across sectors. Thank heavens the bulk of our portfolio is tied to the #1 economy in the world. Whether we realize it or not, our investment decisions and our home bias make us reliant on the U.S. economy. Staying up to speed on the core driver of the economy is a very important factor when managing U.S.-centric portfolios. Holding one or a few dedicated investments in this theme makes that easier. As I’ve written many times, our economy is consumer-spending focused. Spending on needs and wants is in our DNA which makes investing in this theme not only logical but highly profitable. One belief I have stated over and over: If the S&P 500 returns about 10% long-term, the best companies, the dominant franchises operating across important industries should compound greater than the market overall. It’s these companies where our team focuses 100% of our time. I used the +13-15% annual returns as an internal benchmark for leading brands over full market cycles. This is what we should expect and what the data has shown long-term.

The chart below simplifies the opportunity for investors by showing how important the consumption component of GDP is in America. Retail Sales alone is about $7 trillion a year. Consumers spend across a variety of “needs” categories as well as “wants” categories. We invest in leading brands across both needs and wants. Additionally, we are a service economy so roughly two-thirds of GDP comes from services and small businesses. Fun fact, household consumption drives every major economy making a global brands allocation an easy core equity choice for allocators. The consumption in the U.S. accounts for about $18.9 trillion per Morgan Stanley and it grows 2-3% each year with alarming predictability. Even a global pandemic cannot stop us consuming for very long. Just to put an exclamation point on this statement, very few investors have sufficient exposure to the brands dominating across important consumption categories. ETF’s are under-exposed, active funds are under-exposed, and retail investors who chase momentum in tech are wildly under-exposed to iconic consumer brands. That’s the opportunity. Adding important exposure to stocks that are superior operators, have global sales opportunities, and have stellar long-term track records is an easy decision.

Market Health Update: Discretionary is Outperforming Staples (defensives).

Most investors invest in sectors via ETF’s and funds. It’s important to compare the major ETF’s and market cap weighted strategies with equal-weighted strategies because sometimes, the most popular ETF does not tell the whole story in a sector. Monitoring the equal-weighted indices across discretionary & staples is vital to understanding the strength or weakness underlying the real economy. Remember, having this knowledge will help you across all the investments you hold given how reliant everything is to our economy.

The discretionary sector struggled as did all growth and quality-oriented areas of the market in 2022. That was a classic re-set and a raging opportunity to add exposure. About mid-year 2022, something happened, discretionary stocks vs staples stopped underperforming and began to outperform. This tends to happen after big market dislocations, beta begins to outperform low vol. The chart below shows a ratio chart of the equal-weight discretionary vs staples performance. When the line is rising, discretionary stocks are outperforming defensives. The rising line highlights the markets appetite for risk-taking and the overall health of the economy. For now, it’s clearly saying more positive things than you might hear from the media.

Market-Cap Weighted Investments Are Masking Underlying Strength.

Important: most assets across all sectors and index investments are invested in market-cap weighted strategies. That’s been helpful at the index level and has led investors astray when analyzing the consumer stocks. Here’s how the market-cap weighted sector strategies look vs the bullish equal-weighted ones. The chart shows discretionary stocks still under a downtrend but threatening to break over the downtrend.

If I saw this chart and it was a stock, I would say the direction is inconclusive until a clean break of the downtrend line has been accomplished. Clearly, this chart tells a different story than the one above which screams, offense over defense generally across consumer stocks. Both are performing but one is performing better than the other.

SUMMARY:

The over-arching message these ratio charts are telling us: broadly, the consumer stocks are performing better than defensive staples which remains a bullish sign for the U.S. economy and therefore equity markets today. And remember, algorithms and zero-days to expiration index options drive daily market volume so if you are engaged in equities, you must absorb the daily volatility they create. We like to use this volatility to our advantage with fast-twitch active trading when we see the opportunity, which offers a unique and differentiated edge in today’s volatile world.

A reminder about our approach: 1) Offense (discretionary, tech, communication services, and alternative asset managers), 2) Defense (staples, healthcare, holding excess cash), and 3) Special teams (active, fast-twitch trading which can offer multiple years of a company dividend in less than 30 days of risk exposure when executed properly).

Disclosure: The above data is for illustrative purposes only.  This information was produced by Accuvest and the opinions expressed are those of the author as of the date of writing and are subject to change. Any research is based on the author’s proprietary research and analysis of global markets and investing. The information and/or analysis presented have been compiled or arrived at from sources believed to be reliable, however the author does not make any representation as their accuracy or completeness and does not accept liability for any loss arising from the use hereof. Some internally generated information may be considered theoretical in nature and is subject to inherent limitations associated therein. There are no material changes to the conditions, objectives or investment strategies of the model portfolios for the period portrayed. Any sectors or allocations referenced may or may not be represented in portfolios managed by the author, and do not represent all of the securities purchased, sold or recommended for client accounts.  The reader should not assume that any investments in sectors and markets identified or described were or will be profitable. Investing entails risks, including possible loss of principal. The use of tools cannot guarantee performance. The charts depicted within this presentation are for illustrative purposes only and are not indicative of future performance. Past performance is no guarantee of future results.

The Future is Finally Here: September 2024 HANDLS Monthly Report

The Future Is Finally Here

After a year of waiting, investors were finally rewarded with an interest rate cut when the Federal Reserve’s Federal Open Market Committee (FOMC) cut the federal funds rate by 50 basis points (0.50%) on September 18th. In announcing the decision, the FOMC noted that it had “had gained greater confidence that inflation is moving sustainably toward 2 percent” and “that the risks to achieving its employment and inflation goals are roughly in balance.”

The FOMC’s decision followed August’s release of the Consumer Price Index (CPI) report. Monthly inflation came in at 0.2%, in line with expectations. For the 12-month period ending in August, inflation was 2.5%, the lowest level since February 2021. The Federal Reserve’s preferred inflation measure, the Personal Consumption Expenditures Index (PCE), offered even better news, with inflation coming in at 0.1% for August and 2.2% for the 12-month period.

Partly driving the FOMC’s decision were economic reports indicating a softening in what had been a robust economy. The Institute for Supply Management’s monthly survey of purchasing managers came in below expectations for August, while the Bureau of Labor Statistics jobs report indicated that nonfarm payrolls expanded by only 142,000 jobs during the month (against expectations of 161,000 jobs). Both the equity and bond markets responded favorably to the cut in interest rates, with the Core Large Cap Equity and Core Fixed categories gaining 2.5% and 1.3%, respectively, for the month of September.

For the Nasdaq Dorsey Wright Explore portion of HANDLS Indexes, interest-rate-sensitive categories continued to be the biggest beneficiaries of softening inflation and lower interest rates. Utilities saw the biggest boost, gaining 6.6% for the month of September, pushing year-to-date returns to an eye-popping 30.2%. REITs also continued their recent hot strike, gaining 3.2% for the month. At the other end of the spectrum, MLPs were the worst performer for the third straight month (-0.4%) but remained up 17.8% on the year.

HANDLS indexes delivered positive returns across the board in September:

  • Nasdaq 5HANDL™ Index: 1.8%
  • Nasdaq 7HANDL™ Index: 2.2% (1.3x leveraged)
  • Nasdaq 10HANDL™ Index: 3.2% (2.0x leveraged)

Disclosure: Nasdaq® is a registered trademark of Nasdaq, Inc. The information contained above is provided for informational and educational purposes only, and nothing contained herein should be construed as investment advice, either on behalf of a particular security or an overall investment strategy. Neither Nasdaq, Inc. nor any of its affiliates makes any recommendation to buy or sell any security or any representation about the financial condition of any company. Statements regarding Nasdaq-listed companies or Nasdaq proprietary indexes are not guarantees of future performance. Actual results may differ materially from those expressed or implied. Past performance is not indicative of future results. Investors should undertake their own due diligence and carefully evaluate companies before investing. ADVICE FROM A SECURITIES PROFESSIONAL IS STRONGLY ADVISED. © 2024. Nasdaq, Inc. All Rights Reserved

Important Disclosure. HANDLS Indexes receives compensation in connection with licensing its indices to third parties. Any returns or performance provided within are for illustrative purposes only and do not demonstrate actual performance. Past performance is not a guarantee of future investment results. It is not possible to invest directly in an index. Exposure to an asset class is available through investable instruments based on an index. HANDLS Indexes does not sponsor, endorse, sell, promote or manage any investment fund or other vehicle that is offered by third parties and that seeks to provide an investment return based on the returns of any index.  There is no assurance that investment products based on an index will accurately track index performance or provide positive investment returns. HANDLS Indexes is not an investment advisor, and HANDLS Indexes makes no representation regarding the advisability of investing in any such investment fund or other vehicle. A decision to invest in any such investment fund or other vehicle should not be made in reliance on any of the statements set forth in this document. Prospective investors are advised to make an investment in any such fund or other vehicle only after carefully considering the risks associated with investing in such funds, as detailed in an offering memorandum or similar document that is prepared by or on behalf of the issuer of the investment fund or other vehicle. Inclusion of a security within an index is not a recommendation by Indexes to buy, sell, or hold such security, nor is it considered to be investment advice. The information contained herein is intended for personal use only and should not be relied upon as the basis for the execution of a security trade. Investors are advised to consult with their broker or other financial representative to verify pricing information for any securities referenced herein. Neither Indexes nor any of its direct or indirect third-party data suppliers or their affiliates shall have any liability for the accuracy or completeness of the information contained herein, nor for any lost profits, indirect, special or consequential damages. Either Indexes or its direct or indirect third-party data suppliers or their affiliates have exclusive proprietary rights in any information contained herein. The information contained herein may not be used for any unauthorized purpose or redistributed without prior written approval from HANDLS Indexes. Copyright © 2024 by HANDLS Indexes. All rights reserved.