Chart of the Week: is the Stock Market Getting Ahead of Itself?

S&P 500 Cyclically Adjusted Price-to-Earnings Ratio (CAPE)

Even before November’s post-election rally, Wall Street was growing increasingly worried that the stock market was starting to get ahead of itself.

  • In October, Goldman Sachs strategists cautioned investors to be prepared for stock market returns during the next decade that are toward the lower end of their typical performance distribution.
  • As of November 11, 2024, the cyclically adjusted price-to-earnings ratio (or CAPE) hit a staggering 38.12x. Looking at these valuation levels going back to 1900, there has only been one instance where the S&P 500 produced a positive return in the following 10 years. In July 1998, the CAPE hit 38.26x and the 10-year return after was 0.84% annualized.
  • S&P 500 10-year returns averaged -2.75% annualized following valuations like in November 2024.

Thematic Investing Can Add a Ton of Value to Portfolios

Key Summary:

  • Earnings season has begun, we have some solid reports across the brands universe.
  • Streaming video & entertainment has become a consumer staple. Netflix wins.
  • In the asset management industry, private markets are where the information advantages are real. Blackstone wins.

Very Important thesis: If equities generate roughly ~10-11% a year over time, leading brands, dominant global franchises, particularly those serving the dominant driver of the economy, in theory, should compound at 13-15%+ over time. In a world where rates and inflation will likely trend higher for longer, business models with pricing power, exposure to quality factors, and that generate strong profits and free cash are set up to win versus broad markets. Brands Matter.

Earnings Season Has Begun. Here’s a few portfolio brands executing well.

I love earnings season. Each quarterly report is a new piece of the puzzle, and it lets us know what management teams are thinking about their respective businesses, industries, and the economy in general. Remember, our investment in stocks is a De facto vote of confidence on the economies in which we invest. Earnings, revenue, margins, free cash flow, and the growth of these important metrics is what drives stocks up or down over time. As someone who invests but also likes to actively trade when markets act irrational, earnings season tends to offer some wonderful tactical trading opportunities along with offering great, long-term information for buy-hold investors. The next few notes, I’ll discuss some earnings reports and secular themes we are very excited about for the future.

Image created in 10 seconds using AI via ChatGPT. Very cool!

Netflix: NFLX

Remember when the cable industry was one of the most stable and predictable industries?

Legacy media brands sat by and let a new company, Netflix carve out a new market and take market share slowly, then all at once. Fast forward to today, Netflix is now the new cable and the first place most consumer begin their entertainment and content search. This nuance is a massive behavioral moat for Netflix, and I never hear anyone talking about it. Netflix reported a strong and stable quarter on October 17th and the stock is +10% on the 18th, last I checked. Here’s why we continue to like Netflix and why it’s a core holding as a dominant Mega Brand and a consumer staple.

The Report & Our View of the Stock:

Lots of growth potential around the world. 283 million paid subscribers headed much higher over time. Q3, revenue +15% YOY, operating margins 30% vs 22% last year. For Q4, they forecast 15% revenue growth and expect paid net additions to be higher than this quarters 5.1M sub growth. For 2025, they forecast revenue of $43-44B which is +11-13% growth, slower than 2024 but we expected this to moderate as password sharing opportunities diminish. Margins should continue to rise over time as content spend stays stable and revenue and free cash flow expand. And make no mistake, Netflix has solid pricing power to raise prices and drive more ad-tier subs. This business has become a solid consumer staple that adds significant value to a consumer’s life as a primary entertainment provider. The low cost of the service keeps churn low and engagement solid. Live sports and sports-related content will continue to grow bringing in new entrants. NFLX had the benefit of building a massive library of content fueled by debt when rates were largely at ZERO while peers in the industry sat idle and watched NFLX take their businesses. Now they are scrambling to compete in a world with much higher cost of capital and higher content costs. All in all, Netflix offers one of the best value propositions to consumers, has become THE place consumers start their content and entertainment searches which keeps churn low and pricing power high. This is a very powerful flywheel that grows over time with new and intriguing content added.  Traditional consumer staples grow much less, do not generate this kind of profitability and margins and trade at the same multiple or higher as Netflix. More and more, consumer staple brands do not just live in the staples sector. With technology at the center of our lives, there are plenty of tech staples located in plain sight. Yes, tech and communication services stocks can be volatile, but just because their stock can be volatile, do not assume their business is volatile so when these staples go on sale, they are wonderful buying opportunities.

Blackstone: BX

The democratization of alternatives via private market access continues. Blackstone is the largest alternative asset manager on the planet at $1.1Trillion and growing assets at a rapid clip. The crazy part: there is so much room for growth ahead, particularly in the wealth management industry as most HNW investors have very little exposure overall. Here’s a crazy truth: these stocks are very under-owned and underrepresented in indexes, ETF’s, and active funds. And they have been massive alpha generators over the S&P 500. Apollo still needs to be added to the S&P and it’s a matter of WHEN, not IF.

The Brands portfolio owns a basket of the leaders because the secular growth opportunity remains enormous. Blackstone, KKR, Apollo and these brands are the smartest investors around the globe, have massive access to capital in good times and bad, have a wicked information advantage because they each own hundreds of private companies that give them the ability to look around corners for future trends. And they have hundreds of billions in dry powder to buy assets when they go on sale. No matter what the calamity, these great investors always seem to find a way to capitalize on turmoil. Stable, attractive performance just drives more asset flows which drives higher fee revenue which drives the stocks higher.

Like Netflix, the alts business is a wonderful flywheel and the benefits compound over time at scale. Just remember, these stocks can be volatile at times, so you often get a chance to buy them on dips. We love to hold the core position and trade around the position, using the vol to our advantage.

The Report & Our View of the Stock:

Overall, a solid quarter with solid trends for a good 2025. Massive $40.5B new flows this quarter dominated by private credit & insurance but good overall flows into Infrastructure, core PE, plus good fund raising in other real estate and opportunistic credit funds. Management fees $1.7B. Deployed $34B broadly across credit, PE, RE but credit was the big deployment area. Performance stable and solid across fund verticals, with real estate slowly recovering.  $1.17T in assets with $171B in dry powder, so they have massive opportunities to put a lot of money to work over time and to generate solid fees that grow over time. 2025 is expected to show better realizations, and deployments as M&A heats up and sentiment gets better leading to more deals. Their deployments continue to be focused on data centers globally, AI, software, life sciences, and shelter opportunities along with renewables and energy. All of which tend to be solid inflation beneficiaries as rates are expected to stay elevated with elevated inflation.

Image created in 10 seconds using AI via ChatGPT.

Disclosure: The above data is for illustrative purposes only.  This information was produced by Accuvest and the opinions expressed are those of the author as of the date of writing and are subject to change. Any research is based on the author’s proprietary research and analysis of global markets and investing. The information and/or analysis presented have been compiled or arrived at from sources believed to be reliable, however the author does not make any representation as their accuracy or completeness and does not accept liability for any loss arising from the use hereof. Some internally generated information may be considered theoretical in nature and is subject to inherent limitations associated therein. There are no material changes to the conditions, objectives or investment strategies of the model portfolios for the period portrayed. Any sectors or allocations referenced may or may not be represented in portfolios managed by the author, and do not represent all of the securities purchased, sold or recommended for client accounts.  The reader should not assume that any investments in sectors and markets identified or described were or will be profitable. Investing entails risks, including possible loss of principal. The use of tools cannot guarantee performance. The charts depicted within this presentation are for illustrative purposes only and are not indicative of future performance. Past performance is no guarantee of future results.


The Next Potential Volatility Explosion: Oil

Oil Shocks and Their Impact on the Stock Market: A Historical Overview

Oil shocks throughout history, whether caused by geopolitical conflicts or disruptions in production, have had significant effects on both the global economy and stock markets. Events like the 1973 Arab Oil Embargo and the 1979 Iranian Revolution led to sharp supply shortages, surging prices, and steep market declines, as economies struggled with inflation and stagnation. Similarly, more recent shocks, such as Iraq’s invasion of Kuwait in 1990 and Russia’s invasion of Ukraine in 2022, caused market volatility due to rising oil prices and global uncertainty. Understanding these historical patterns is crucial for portfolio managers seeking to mitigate risks during future oil disruptions.

By analyzing past oil shocks and market reactions, investors can better prepare for potential downturns and explore strategies to hedge against volatility. Maintaining a diversified portfolio and considering exposure to the energy sector are effective ways to navigate the unpredictability of global oil supplies.

Oil shocks, significant disruptions in the global oil supply that cause price spikes, have consistently influenced the stock market. Let’s delve into some major oil shocks and their market reactions:

1. 1973 Oil Crisis (Arab Oil Embargo)

  • Cause: OPEC’s reduction of oil exports to the U.S. and allies in response to the Yom Kippur War.
  • Impact: A 300% surge in oil prices, energy shortages, soaring inflation, and global recession.
  • Market Reaction: Stock markets plummeted due to rising energy costs and economic uncertainty. Inflationary pressures, known as “stagflation,” led to a prolonged period of economic instability and market recovery.

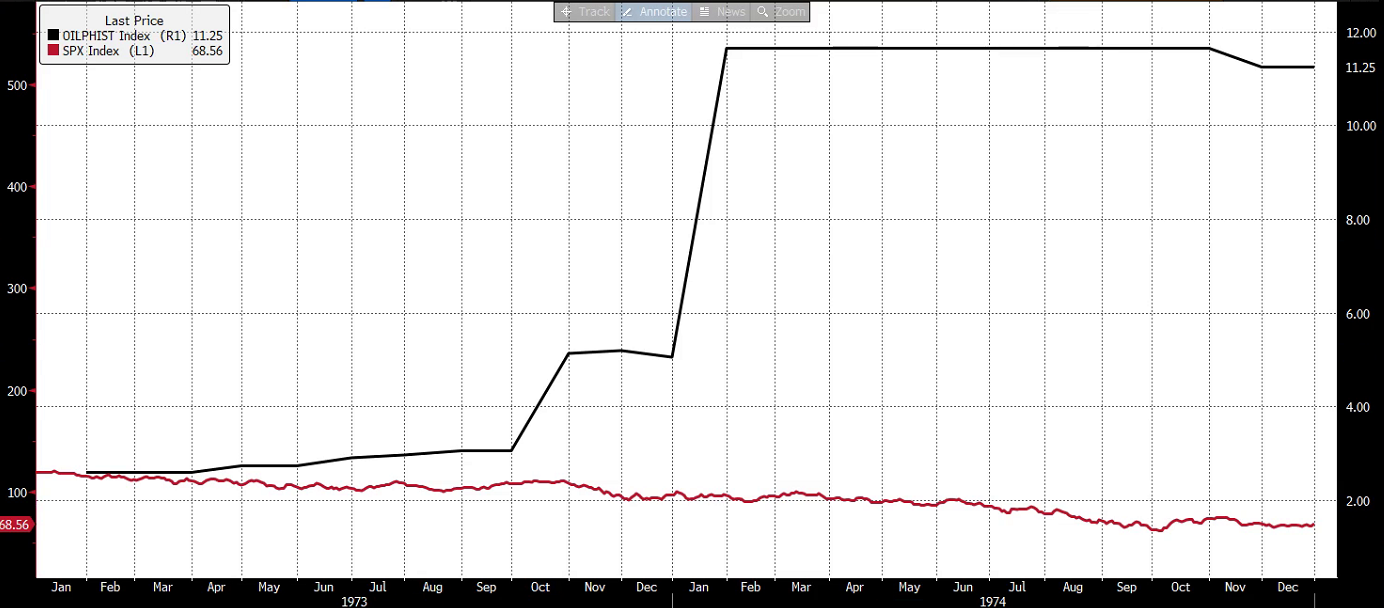
The 1973 oil crisis, triggered by OPEC’s reduction of oil exports in response to the Yom Kippur War, was a significant shock to the US economy. The oil price surge of 300% led to energy shortages, soaring inflation, and a global recession. The stock market experienced a near-50% decline, reflecting the widespread economic uncertainty. Today, a similar supply disruption localized to Iran might have a less severe impact due to increased energy diversification. However, a broader conflict involving other oil-producing states could escalate into a much larger supply shock, potentially leading to more significant economic consequences.

2. 1979 Oil Crisis (Iranian Revolution)

  • Cause: Disruptions in Iranian oil production due to the revolution.
  • Impact: A doubling of oil prices, high inflation, and economic stagnation.
  • Market Reaction: Stock markets experienced another significant drop, further exacerbated by domestic inflation. Recovery was slow, with inflation persisting into the early 1980s.

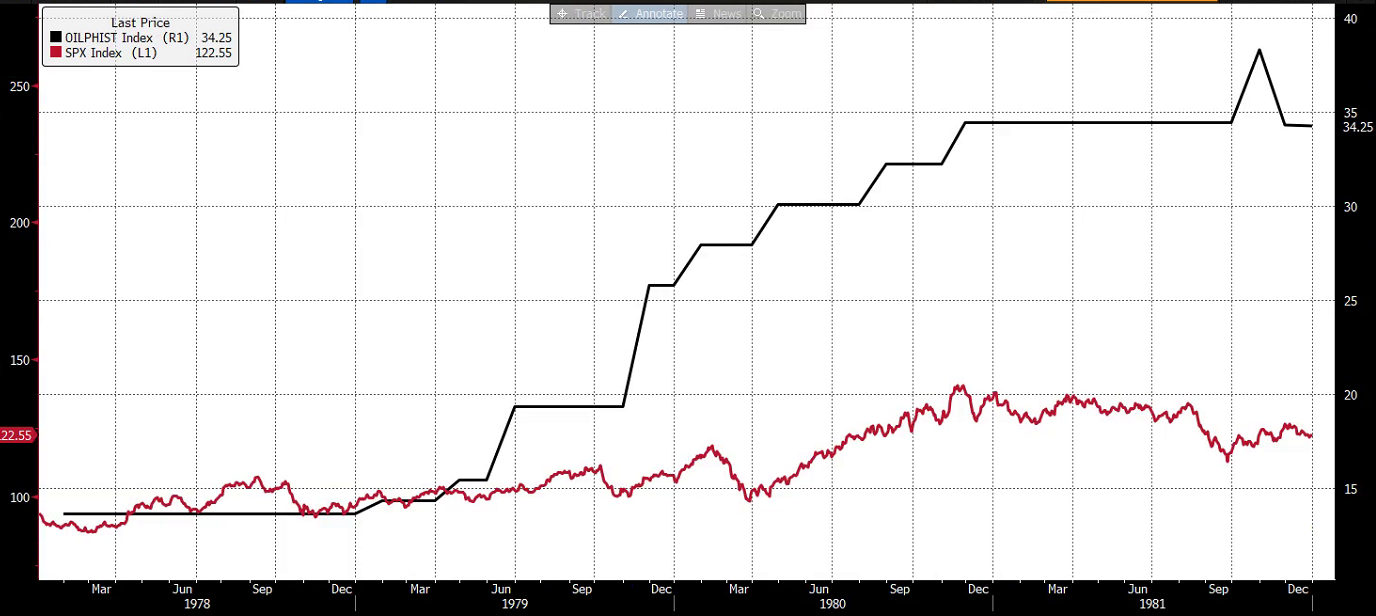
The 1979 oil crisis, caused by disruptions in Iranian oil production due to the revolution, led to a significant oil price spike, doubling prices and contributing to high inflation and economic stagnation. The stock market experienced a substantial decline, further exacerbated by domestic inflation. Recovery was slow, with inflation persisting into the early 1980s. Today, a similar supply shock originating from Iran could have a comparable impact. The 1970s were a volatile period, characterized by a struggling economy and a highly volatile stock market with multiple double-digit corrections. The introduction of Reaganomics, known for its tax cuts and deregulation policies, might also find parallels in today’s economic landscape.

3. 1990-1991 Gulf War (Iraq’s Invasion of Kuwait)

  • Cause: Threats to oil production in a major oil-producing region.
  • Impact: A temporary increase in oil prices, but less severe than previous crises.
  • Market Reaction: A temporary decline in stock markets, followed by a relatively quick recovery. The economic damage was less pronounced.

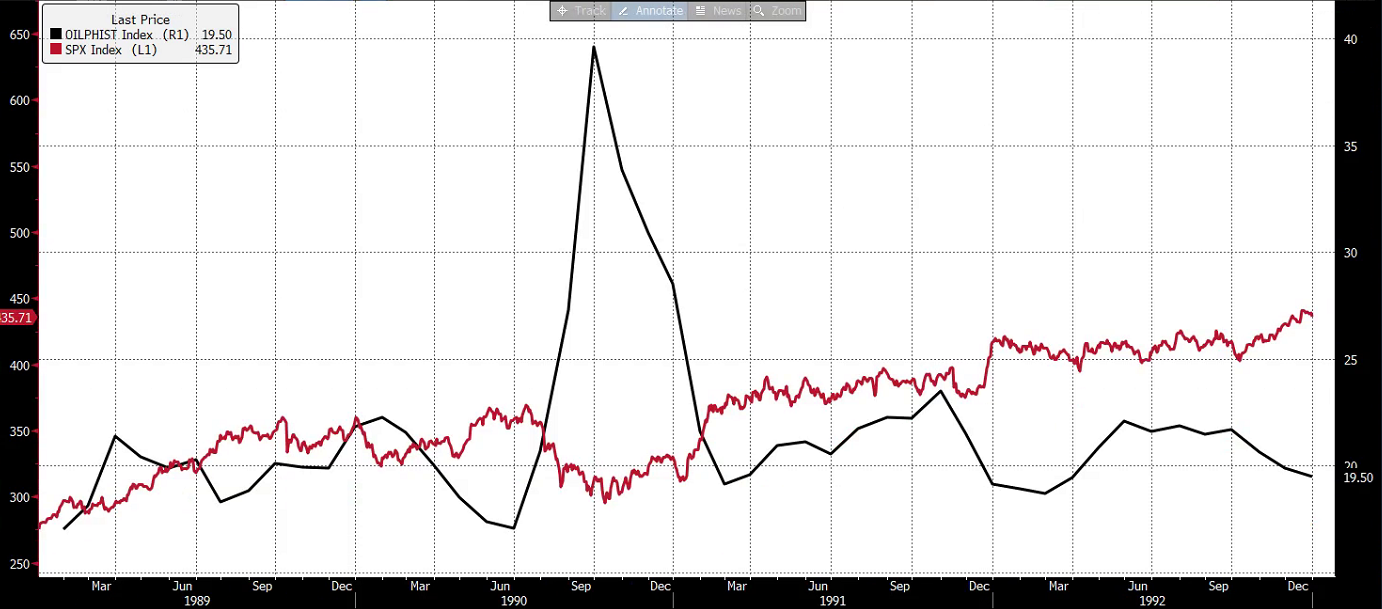
The 1990-1991 Gulf War, triggered by Iraq’s invasion of Kuwait, disrupted oil production in a major oil-producing region. This led to a temporary increase in oil prices, although less severe than the previous two crises. The stock market experienced a temporary decline, but recovered relatively quickly. The economic damage was less pronounced compared to the earlier oil shocks, despite the significant disruption in oil supply caused by the war.

4. 2008 Financial Crisis

  • Cause: A global economic downturn triggered by the housing market collapse.
  • Impact: Decreased oil demand and a temporary drop in oil prices.
  • Market Reaction: A dramatic collapse in stock markets worldwide, with the oil sector hit hard. The market experienced a prolonged recovery with high volatility.

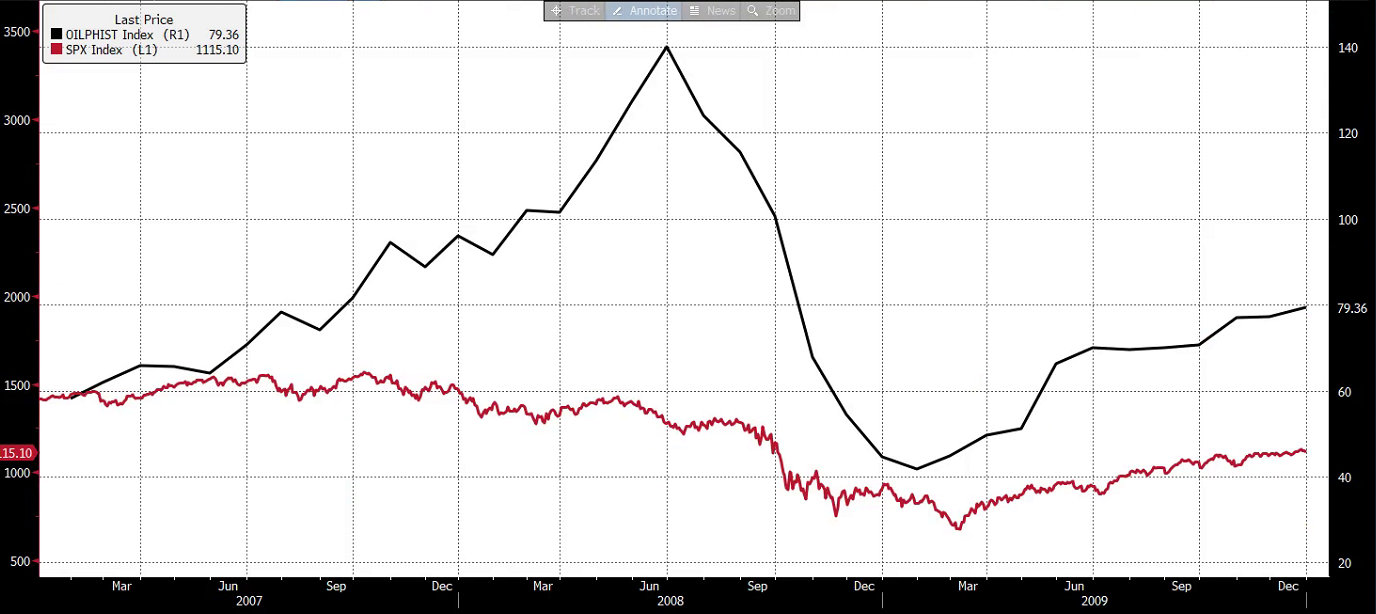
The 2008 financial crisis, triggered by the housing market collapse, represents a distinct departure from previous oil shocks. While there was no supply-driven disruption, the global economic downturn led to decreased oil demand. The oil sector was significantly impacted, and the stock market experienced a dramatic collapse. The unusual circumstances of the crisis, including the collapse of banks and disruptions in global trade, led to a prolonged period of market volatility and economic recovery.

A key factor contributing to the economic downturn was the sharp rise in oil prices during the early stages of the crisis. These elevated prices further exacerbated the economic weakness, creating a vicious cycle of rising costs and declining demand. Ultimately, the weak economy forced a decrease in oil demand, leading to a decline in oil prices.

While there were various factors influencing the oil price increase, including speculation and geopolitical tensions, the overall economic weakness played a significant role in driving prices down. This unique combination of circumstances made the 2008 oil shock distinct from previous events.

5. 2022 Russia-Ukraine War

  • Cause: Sanctions on Russia, a major oil producer, following its invasion of Ukraine.
  • Impact: A sharp rise in oil prices, increased inflation, and economic uncertainty.
  • Market Reaction: Initial stock market declines due to fears of prolonged conflict, followed by volatility and a surge in energy sector stocks. The long-term impact remains uncertain.

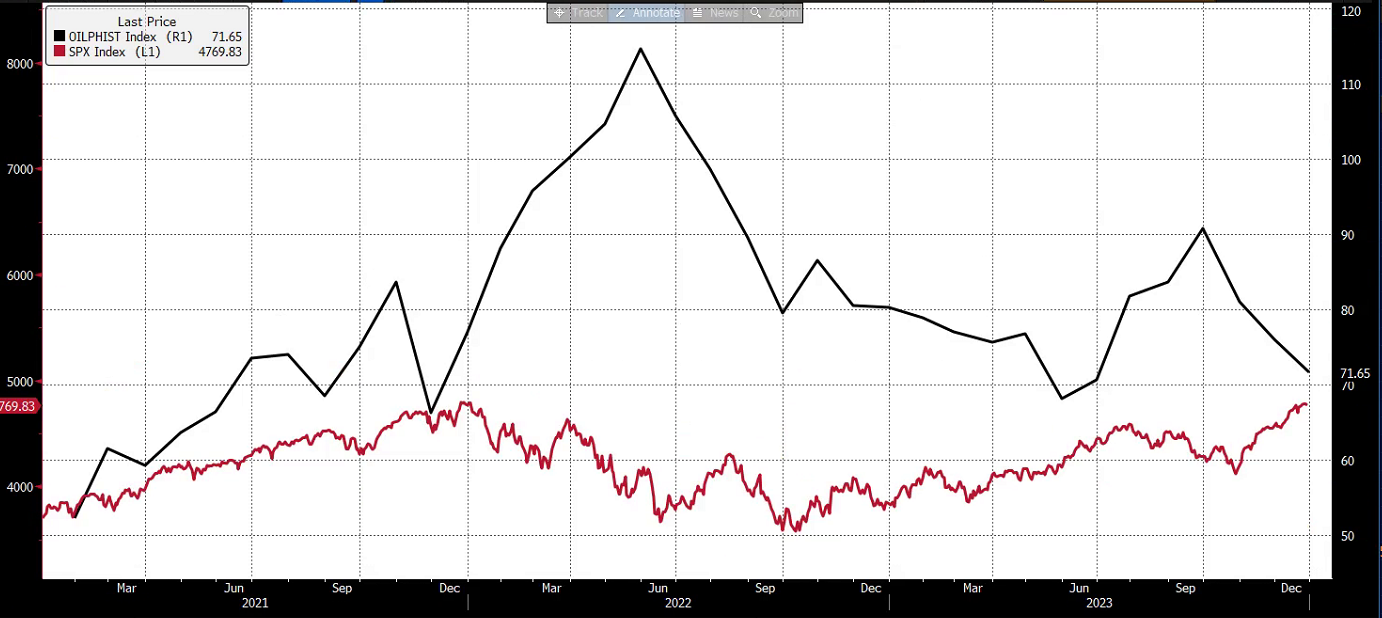
The 2022 Russia-Ukraine War, marked by sanctions on Russia, a major oil producer, closely resembles the current economic landscape. The sharp rise in oil prices, reminiscent of previous oil shocks, has contributed to increased inflation and economic uncertainty. While the potential for increased US oil production could help mitigate price increases, the current situation has exacerbated an already challenging economic environment. Similar to past oil shocks, the rise in oil prices has contributed to higher inflation, leading to stock market declines.


Key Takeaways:

  • Oil shocks can lead to significant short-term volatility and long-term economic impacts.
  • The severity of market reactions varies based on the duration and magnitude of oil price spikes.
  • Economic conditions, interest rates, and investor sentiment also influence stock market performance during oil shocks.
  • Understanding the historical context of oil shocks can help investors better anticipate and navigate potential market disruptions.

While it may be tempting to increase our energy allocation in response to rising oil prices, it’s crucial to maintain a cautious approach. Predicting the future direction of oil prices is challenging, as various factors, including geopolitical events and global economic conditions, can influence supply and demand.

One potential scenario is an attack on Iran’s oil facilities, which could significantly disrupt global oil supply. However, it’s equally possible that the market is already anticipating such an event, leading to increased oil production elsewhere. This uncertainty highlights the importance of remaining flexible and prepared for potential volatility.

As a portfolio manager, it’s prudent to maintain our appropriate allocations while incorporating additional volatility measures. By remaining diversified and considering potential market swings, we can better manage risk and position our portfolio for long-term success.

Navigating the Rate Cut: A Guide for Advisors

Introduction

The ongoing Federal Reserve cycle has sparked intense debate regarding its resemblance to the 2007 and 1998 financial crises. While a definitive answer remains elusive, the devil is indeed in the details. The current economic landscape shares similarities with both 2007 and 1998, but the specific outcomes remain uncertain. The stark contrast between the record-breaking stock market of 1998 and the near-50% decline in 2007 underscores the importance of discerning the underlying factors driving each crisis. However, one consistent element across these periods is the rise in volatility following Federal Reserve rate cuts.

Source: Bloomberg

Historical Context and Current Trends

A recurring pattern emerges in financial markets: a steepening yield curve often coincides with increased volatility. This phenomenon is evident in both 2007 and 1998, as well as other periods of economic downturn.

Source: CME Group

  • The Volatility Cycle: The yield curve’s movements often correlate with cyclical volatility patterns. A flat yield curve, typically associated with the end of an economic expansion and higher interest rates, often precedes a period of lower volatility. When the Federal Reserve cuts rates, steepening the yield curve, volatility tends to rise. This peak in volatility often coincides with the steepest point of the yield curve.
  • The 2007 and 1998 Comparison: While both 2007 and 1998 featured a steepening yield curve and rising volatility, the underlying causes differed. In 1998, a volatility shock triggered by the Russian debt crisis prompted the Fed to lower rates. Conversely, in 2007, the Fed’s rate cuts were a response to a deteriorating labor market.


Volatility and the yield curve, often described as mean-reverting, exhibit a similar cyclical pattern of highs and lows.

The Current Landscape

The Federal Reserve’s decision to lower interest rates in 2024, amidst a backdrop of declining inflation and market volatility, raises questions about the similarities and differences to past crises. While the exact trajectory remains uncertain, the rising yield curve and increasing volatility suggest a potential parallel to the many times in history the Yield Curve got steeper.

The visualization below demonstrates the historical pattern: As the yield curve (in black) rises, volatility (in orange) follows suit.

Source: Bloomberg

Conclusion

As the financial landscape continues to evolve, understanding the historical context and current trends is essential for making informed investment decisions. By recognizing the cyclical nature of volatility and leveraging specialized strategies, investors can mitigate risks and protect their portfolios from market downturns.


My 50-Cents – Fed Analysis from Leland Abrams of Wynkoop, LLC

The Federal Reserve Board cut their benchmark rate this week by 50 bps to a new range of 4.75% – 5.00%.  They indicated this is the start of a rate cutting process and further cuts were coming, likely another 50 bps by year end.  The market had been pricing in an approximate 65% chance of this happening the day of the decision.  We boldly prognosticated this larger than usual rate cut more than two months ago when the market was not even fully pricing in a chance of a 25 bps cut at the September FOMC meeting.


Anyone who has observed the material weakening in the labor market coupled with quickly dropping inflation (and deflation in economically sensitive areas) in addition to the very weak observations in the Fed’s Beige Book should not have been surprised by the size of this first rate cut.  Fed Chairman Jay Powell brought up the Beige Book without being prompted when defending his rate cut during the press conference on Wednesday.  The Beige Book, a qualitative summary of business and economic activity by region, did not paint a good picture.  According to its findings, more than half of the Federal Reserve Districts are already in a recession (declining economic activity) and another quarter are experiencing stagnant growth.  This report does not jive with the Bureau of Labor Statistics’ GDP reports.  We believe the Beige Book offers a better, real-time, glimpse into what is happening on the ground with respect to the economy.  This clearly spooked Jay Powell.


We have written ad nauseum about inflation coming down and likely being lower than the reports indicate.  For example, if the U.S. used the European calculation for inflation, we would see a YoY number in the high 1%s, below the Fed target of 2%.  Economically sensitive areas are experiencing outright and accelerating deflation.  While GDP measures aggregate demand of the economy, one must look at the supply side to see where prices are going.  Aggregate supply has outstripped aggregate demand, which puts DOWNWARD pressure on prices.  Also, the commodity complex has been performing terribly despite a weaker dollar (weak dollar usually makes commodities rally).  We see little to no reason to be concerned about inflation reigniting.


The bond market was mostly ahead of the Fed’s cut and now the two are relatively in sync with each other (bond futures pricing and Fed dot plot).  We noted previously that the longer end of the curve could become stuck and we favored the front end of the curve, which still has significant room to drop.  The initial reaction to the Fed 50 bp cut was actually to see bonds selling off (an example of buy the rumor, sell the fact).  If we study the analogs of 2000/2001 and particularly 2007 (the 2-year note behavior is almost identical), we see some correction selling off (yields moving slightly higher) in the short term, only to resume a significant bull-steepening rally of the rate curve in the coming months.


We are not in the soft-landing camp.  We think the Fed was and still is behind the curve and believe it is unlikely they can arrest the deterioration in the jobs market and hence economic activity.  If history rhymes, the recession we’ve all been waiting for (and many who have given up on) may have just begun.